Global Dashboard Overview
SANnav Global View provides comprehensive "global" visibility across multiple SANnav Management Portal instances. The default scope includes all SANnav Management Portal instances but you can customize the scope to choose specific instances.
Data is retrieved from SANnav Management Portal instances on-demand (data is not stored in a Global View database), and the Global View dashboard is auto-refreshed every 15 minutes.
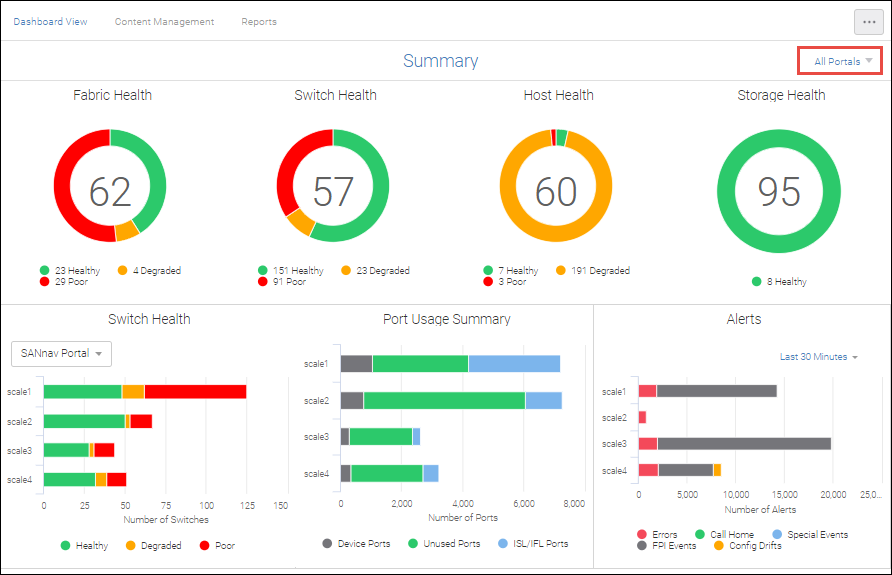
The Global View Summary dashboard provides the following widgets: Health summary, Switch Health, Alerts, and Port Usage Summary. These widgets indicate the status of the fabric, switch, host, and storage entities connected to SANnav Global View.
The instances of each widget are categorized by health state: Healthy, Degraded, or Poor. Listed below each widget are the exact number of entities in each health state.
The health state for each type of object is determined by its health score, which is determined by a set of predefined factors. For example, a health score for fabrics is influenced by whether a link is down or redundant paths are missing. For more details, see Dashboards.
Health State | Health Score |
|---|---|
Healthy | Greater than 90 |
Degraded | Between 71 and 90 |
Poor | Less than 70 |
The health information is retrieved from each of the SANnav Management Portal instances and an aggregate Global View is presented. Health calculations for various entities are done at the SANnav Management Portal level.
SANnav dashboards allow you to gather additional information by drilling down into the dashboard widgets.
By default, the Network Scope of SANnav Global View is set to All Portals (that is, all Management Portal instances). You can choose one or more Management Portal instances to change the network scope.
Unlike SANnav Management Portal, Date Range in the "global" context is not applicable to Dashboard. Date range is only applicable for the Alert widget, which is provided at the widget level itself.
Parent topic