Monitoring Fabric Health
The Fabric Health widget of SANnav Global View shows the number of fabrics in Healthy, Degraded, and Poor state. The least overall score across all objects in this group of fabrics is shown in the center of the circular widget.
The following procedure shows how to use the Global View dashboard to investigate the health state of fabrics across all Management Portals. You can similarly investigate the health state of switches, hosts, and storage using the respective circular widgets.
1. Click the Dashboard icon (  ).
).
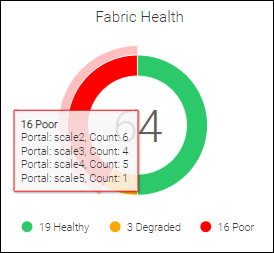
).2. Hover over a colored portion of the Fabric Health widget to display details of the fabrics with that state.
For example, hover over the red portion to display a list of portals and the number of fabrics in each portal having a poor state.
3. To view further details on the fabrics, click the colored segment of the widget.
For example, clicking the red segment displays a table showing the health scores for the fabrics in poor health.

4. Click Show Details on the action menu of the fabric list to see details associated with that health score.
The Show Details option is available only if the score is less than 100.

5. Click Back to return to the list of portals.
6. If you select Show in SANnav Portal from the action menu, you see the Management Portal instance responsible for the data you are viewing.
You might need to make sure that popups are not blocked in your browser.
If you are not logged into this portal, credentials (for this portal) are required.

Parent topic