Monitoring Switch Health Across Management Portal Instances
The Switch Health widget displays details of switch health across Management Portal instances. You can get a summarized view as well as details of switches based on firmware version, Management Portal instance, switch model, and product category.
The following procedure shows how to use the Global View dashboard to display switch health across multiple Management Portal instances.
1. Click the Dashboard icon (  ).
).
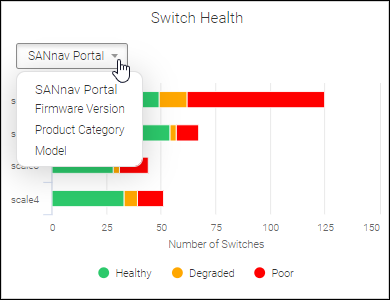
On the bottom row of the dashboard, the Switch Health widget displays.
In this screen you see switches grouped by SANnav Portal instances. You can select a different grouping from the drop-down list.
2. Hover over the graph to display details.
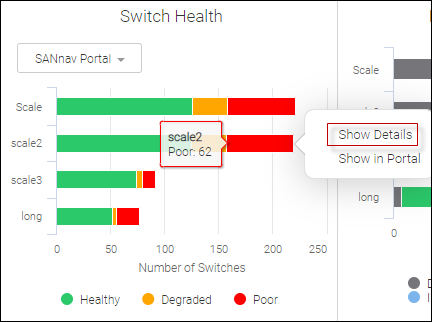
Note that for the Firmware Version and Model categories, more bars are displayed in the graph than are listed in the row names on the left. In this case, hover over an intermediate bar in the graph to display the details.
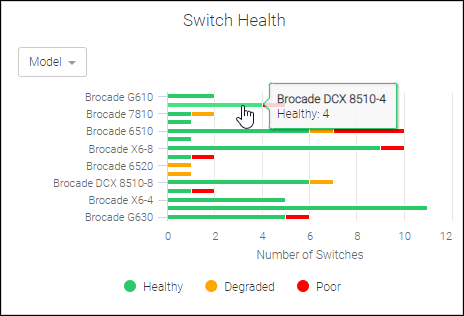
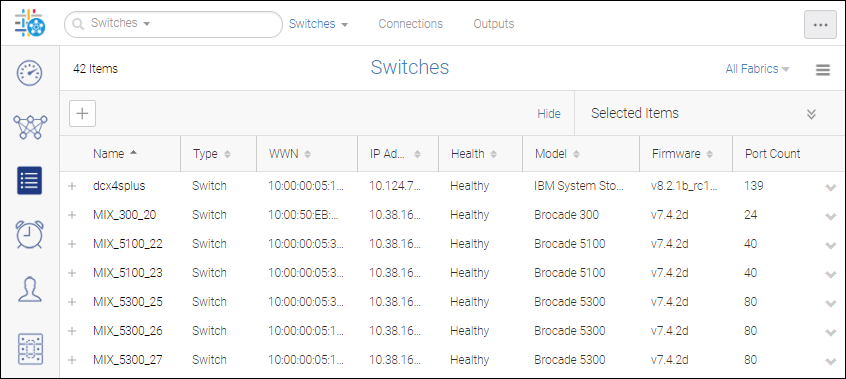
3. To see the details on all switches in a particular category (in this case, Poor), click the bar chart of the widget in the Global View dashboard, and then select Show Details.
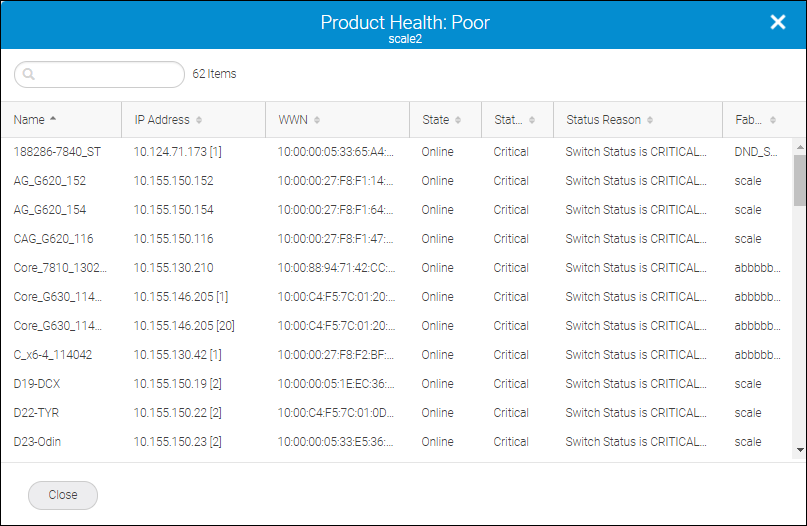
4. Click Close to return to the dashboard.
5. Select SANnav Portal from the drop-down list in the widget, click the bar graph, and select Show in Portal to display the switch inventory in the selected SANnav Management Portal instance.
If you are not logged into this portal, credentials (for this portal) are required.
A separate window opens for the Management Portal instance.
Parent topic