Investigate Switch Ports
Similar to SANnav Management Portal, SANnav Global View investigation enables you to search for and investigate switch ports. The switch ports span all the SANnav Management Portal instances added to SANnav Global View. Unlike Management Portal monitoring, Global View monitoring is "historical" only. "Real time" monitoring is unavailable.
Investigation view is enabled for all FC protocol switch ports; for FCIP, it is enabled for GiGE_port type switch ports, and for Ethernet, it is enabled for ETH type switch ports.
Note: You must create a switch port filter to display ports of interest in the Inventory.
The following procedure shows you how to investigate switch ports.
1. Click the Inventory icon (  ) in the left navigation bar, and after applying the two filters used in the ( Switch Inventory) chapter, the list of switch ports looks like the following.
) in the left navigation bar, and after applying the two filters used in the ( Switch Inventory) chapter, the list of switch ports looks like the following.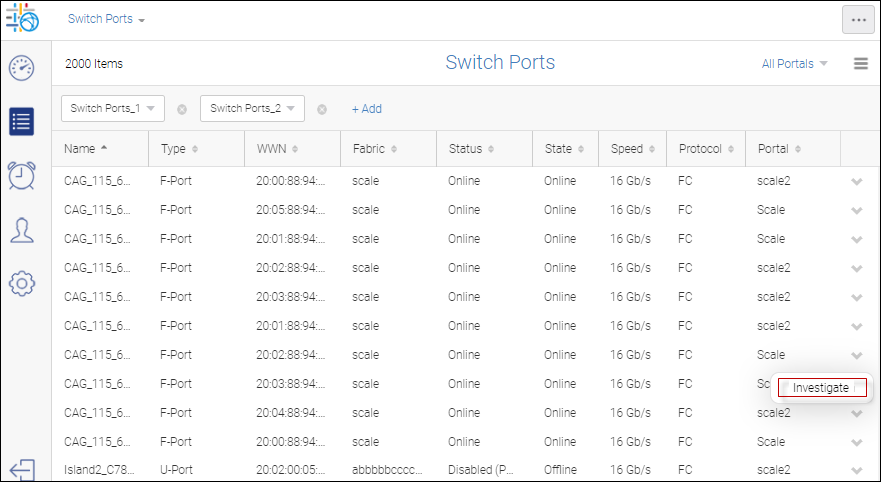
2. Select Investigate from the action menu for the switch port you want to investigate.
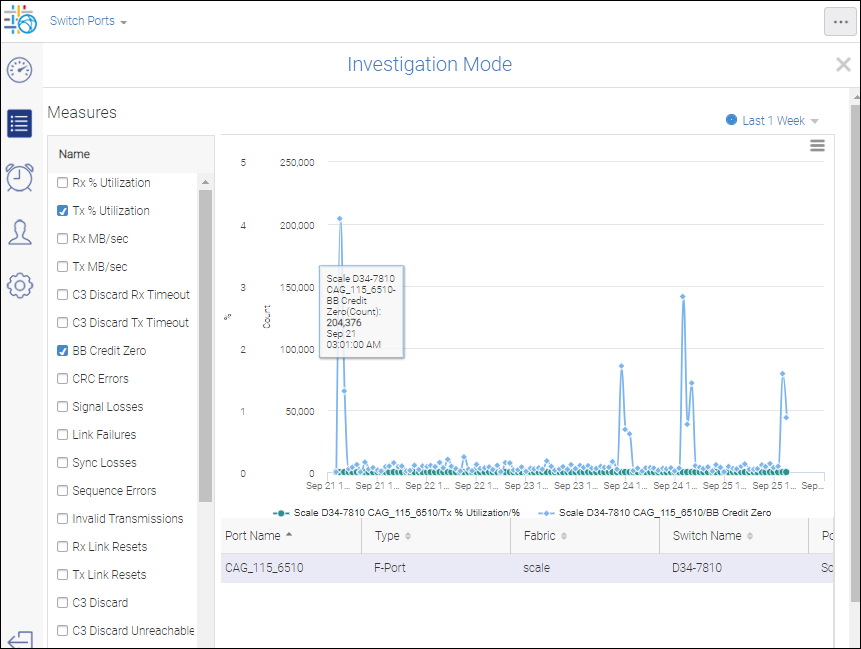
The selected port displays in Investigation Mode.
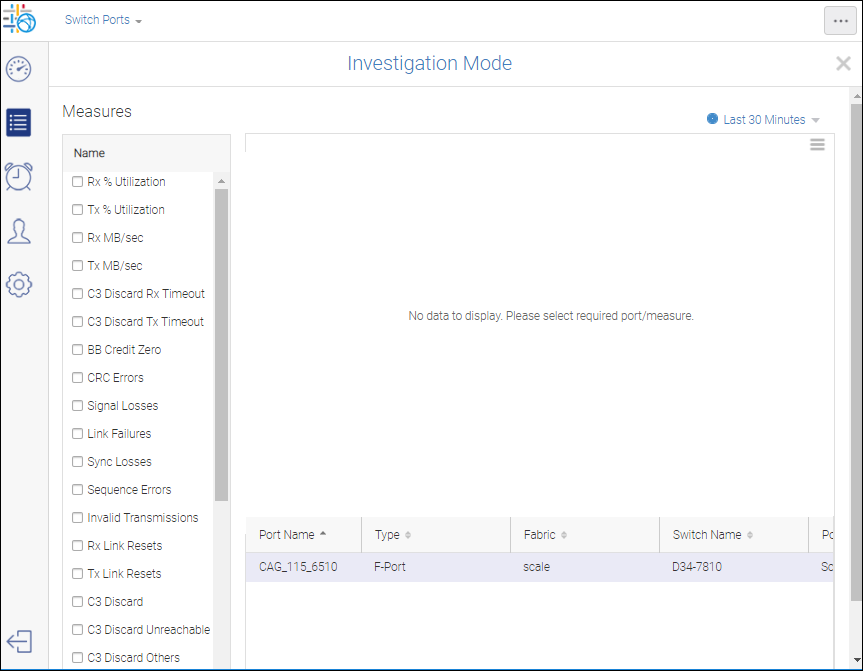
By default, this page is blank. You must select measures to obtain the related details.
3. Select two measures: Tx % Utilization and BB Credit Zero.
Note: The list of available measures depends on the selected port type.
If you hover on a point of the graph, you see the details associated with that point.
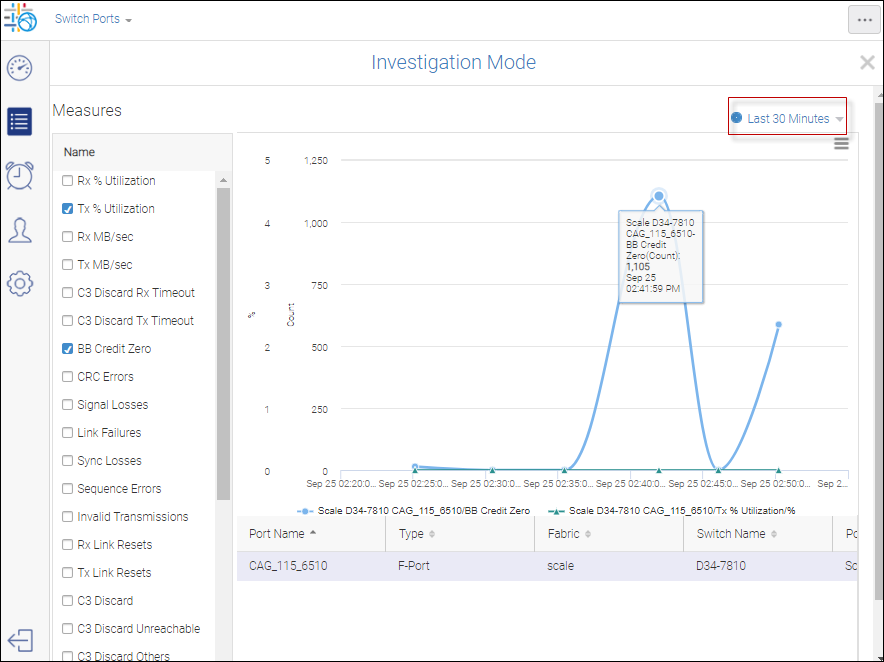
The date/time of the graph is shown in the upper right drop down. By default Last 30 Minutes is selected.
4. To change the scale of the date/time, click the drop down to display the Select Date Range dialog.
Note: You can select a maximum range of 30 days.
On this dialog, you can either select a predefined time interval or manually specify an date range.
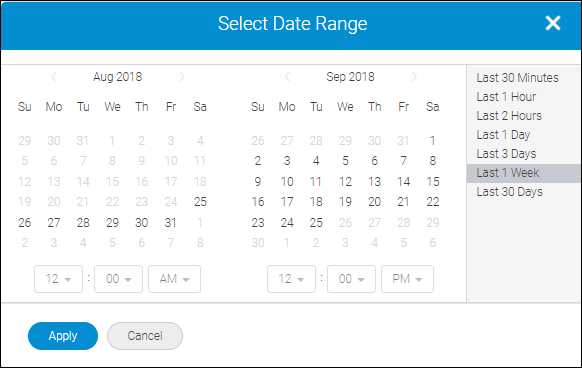
5. Select Last 1Week.
Investigation Mode displays with an expanded time scale for the given port and measures.
Parent topic