Configuring Report Content
To create a new report, you first select widgets, then add or create a filter, and finally set a network scope and date range.
For example, to create content for a Fabrics Report, perform the following:
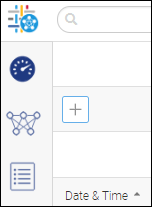
1. Click the Dashboard icon (  ), and then select the Content Management tab.
), and then select the Content Management tab.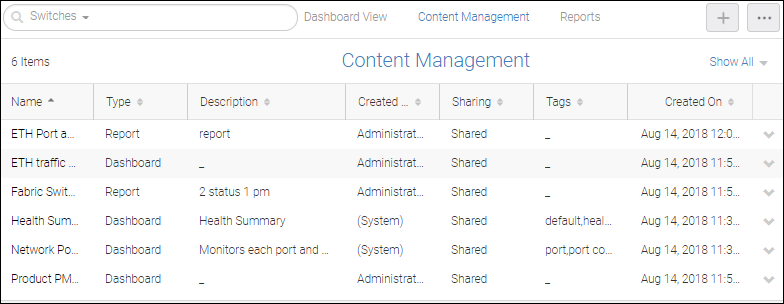
By default, the list includes Dashboards and Reports (All).
2. Click the + button and select > to quickly populate report content.
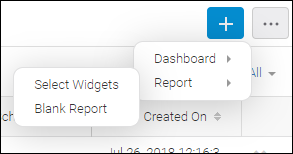
Alternatively, you can select > to display the Create New Report page where you have more control of the content and format of the report.
3. From the Create New Report page, select > .
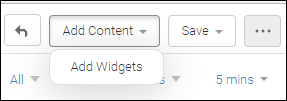
The Select Widgets dialog box displays.
You can select Status or Performance from the drop-down list to display different widgets.
4. Select the desired widgets, click the > icon to move them under Selected Widgets, and click OK.
Note: You can select the same report widget repeatedly; no restriction applies.
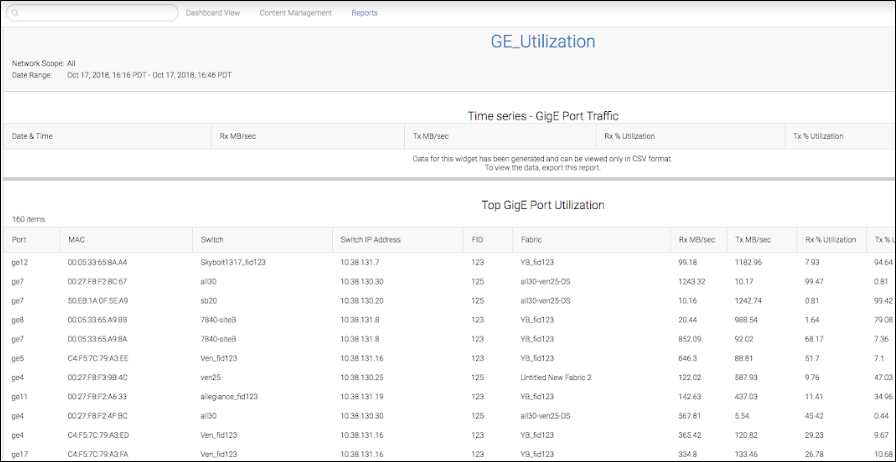
If you selected the performance widgets Time Series - GigE Port Traffic and Top GigE Port Utilization, a new report content page like the following displays.
The template has placeholders for table or chart widgets. (The widgets are empty because this is a template rather than an actual report.) For table widgets, only the table header with column names is displayed. For chart widgets, the widget blank area is displayed.
A measure criteria filter is available for six widgets: Top Port Traffic, Top ISL Utilization, Top Initiator utilization, Top Target utilization, Top Eth port traffic and Top Gige Port Traffic. Each widget has four types of measure criteria that can be applied with less than or greater than operators to filter out the required data.
A time series widget displays as a table, the first column of which shows date and time series data for all selected measures in chronological order within the selected date range.
Time series reports support only CSV not HTML/PDF; a report in HTML/PDF format contains no content. To view time series reports, you must "export" them.
By default, the network scope is All and the date range is Last 30 minutes.
5. (Optional) Customize the report.
a. Click Show Filter on the upper toolbar and click the + button that appears on the far left.
The Add Filter dialog displays over the current page and lists all the existing saved filers. If you do not have previously saved filters, this dialog box is empty.
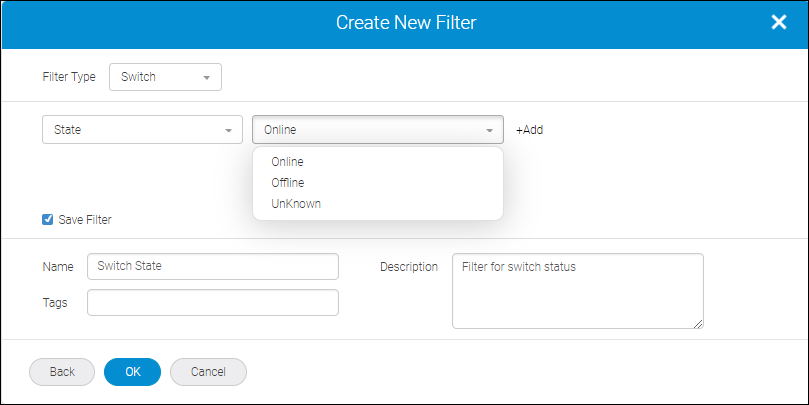
You can select one of the saved filters or click Create New to display the Create New Filter dialog where you can apply Fabric, Switch, Switch Port, Host, Host Port, Storage, Storage Port, and Events Type filters with all the necessary parameters. The report output will display the data for the applied filters.
Note: Although there is no restriction on the number of filters that can be added or applied as part of the report template, it is recommended that you follow this guideline: two parameter conditions within a filter and two filters within a report.
You could create a new filter that is not saved for future use but is retained in the report template. Or, you could check Save Filter and enter a name and description.
In the following example, a filter is created of type Switch and is designated Switch State.
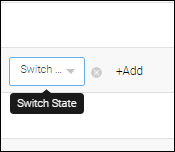
When you click OK the new filter is listed in the Filter layer on the Create New Report page, as shown here.
b. Click the Network scope drop-down to select a network scope for the report output.

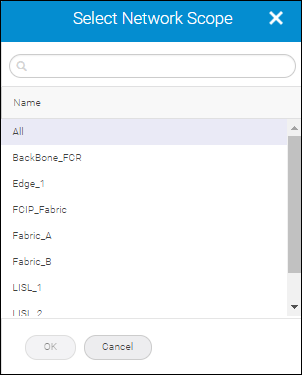
This scope will apply to all widgets in the template.
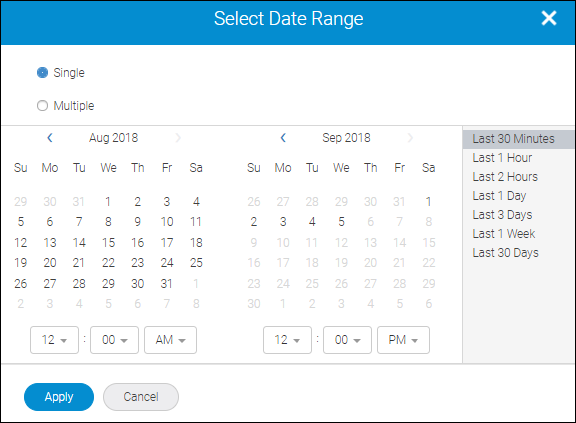
c. Click Date Range drop-down list. Then select either Single or Multiple on the Select Date Range dialog box.
▪ Single – applies either a pre-defined date range (Last 30 minutes through Last 30 days) or a single date range with start and end time.
Note: Single is equivalent to date range in the Dashboard template.
▪ Multiple – applies start and end times for multiple time ranges (max of three) over the previous 24 hours. The 24 hours can be partitioned into three time ranges.
In the following image you set a single date range of Last 30 Minutes.
If you select Multiple you can specify multiple date ranges as shown below.
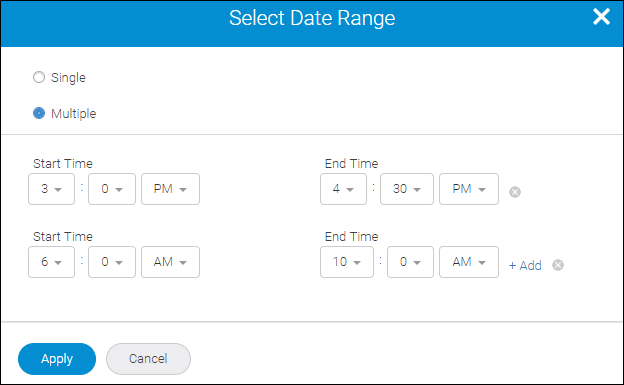
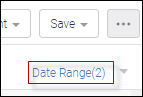
If you do this and click Apply, Date Range drop-down reflects that two schedules have been set.
6. Complete the Template Details dialog box and click Save.
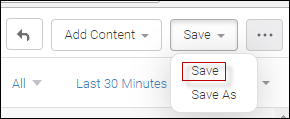
Click Save to save the template. The new template is saved on the Content Management page. A Report is not generated.
Click Save As to copy an existing report template and save with a new name, description, and tag. A Report is not generated.
When you save the template, you must supply a name for the template, as well as optional tags and description. The template name can contain only alphanumeric characters, as well as the hyphen ( - ), underscore ( _ ), and period ( . ).
7. Click the More button (  ), and then select Generate Report.
), and then select Generate Report.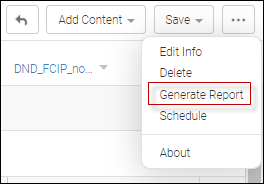
The generated report is listed under the Reports tab.
The newly-added report is highlighted.
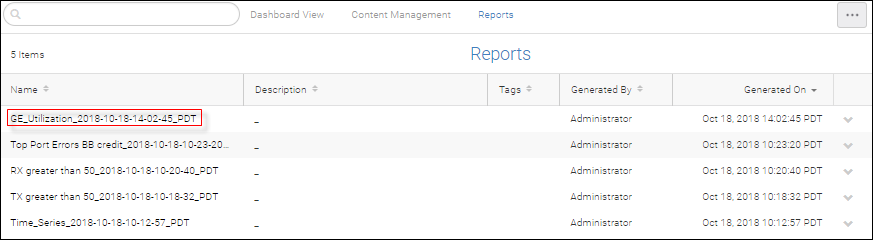
8. Click the report to display an HTML version.
Parent topic