Troubleshooting Mode
The Troubleshooting Mode page provides details on the ports and the metrics that are monitored to determine the port congestion severity states as displayed in the Network Port Traffic Conditions dashboard. This detail should help you identify the cause and source of congestion issues.
Click the hamburger icon located on the top right of the graphical display on the Network Port Traffic Conditions dashboard graphical display, and selectTroubleshoot to display the Troubleshooting Mode page. Data is monitored for the Troubleshooting Mode line graphs and the port metrics table below the line graphs for the last 30 minutes, 1 hour, or 2 hours, depending on the time frame selected from the date range drop-down on the Network Port Traffic Conditions dashboard.
Figure 12. Troubleshooting Mode Page

1. Graphs showing number of ports in congestion severity states
2. Show Ports drop-down
3. Network scope display
4. Date Range display
5. Pop-up display when data point selected
6. Port type and severity state selectors
7. Top drop-down
8. Table of port information and congestion metrics
9. Hamburger icon for adding or removing columns on metrics table
10. Action menu selector (Investigate)
The Troubleshooting Mode page displays line graphs indicating the number of F_Ports, E_Ports, and EX_Ports that are in a specific congestion severity state over time. Each port type and severity state displays as a different colored line graph. Hover your cursor along a line graph and click on data points to display the number of ports detected in various congestion severity states at different time intervals. Complete information on the congested ports, including the metrics used to determine their congestion states, displays in the table below the line graphs. Clicking on a data point on a line graph refreshes data in the metrics table for that time interval.
You can add and remove graphs for the following port types and congestion severity states using the port type and severity state selectors below the graph display area:
• E_Port Severe
• E_Port Moderate
• E_Port Mild
• F_Port Severe
• F_Port Moderate
• F_Port Mild
Note: For details on these congestion severity states, refer to Congestion Severity States.
The Date Range indicator at the top right corner of the page displays last 30 minutes, 1 hour, or 2 hours, depending on the time frame selected from the date range drop-down on the Network Port Traffic Conditions dashboard.
The network scope display at the top right corner of the page displays the fabrics that were selected for monitoring on the Network Port Traffic Conditions graphical display. Note that All appears if all discovered fabrics were selected.
To modify the graph display, use the following features:
• Add and remove graphs for different port types and severity levels by clicking a port type and severity state selector below the graph display. Each selector is color-keyed to a line graph.
◦ Click a fully-visible selector to deselect it and remove the graph.
◦ Click a partially-visible selector to select it and add the graph.
Note: Congestion severity and metrics for EX_Ports will display using the E-Port Severe, E-Port Moderate, and E-Port Mild selectors.
• Add and remove graphs for port types only (F_Ports, E_Ports, or E_Ports and F_Ports), by clicking the Show Ports drop-down at the top right corner of the page.
To modify the display of the table of congestion metrics below the line graphs, use the following features:
• Click any point along a line graph to update data in the table for that data point.
• Click the Top drop-down above the table and select 10, 50, or 100 rows to display in the table.
• Select "Columns" from the hamburger icon on the top right side of metrics table to add or remove data columns from the table.
Port Information and Congestion Metrics Table
The following congestion metrics display in the table below the line graphs that monitor congested ports.
• Name—Port name, if configured on the switch. If a name (alias) is not configured, the port World Wide Name (WWN) displays. Icons by the name indicate the congestion severity state as follows:
• FID—Fabric ID of switch where port resides.
• Switch—The name of the switch where the port resides.
• Connected to—The name of the device to which the port is connected will display for an F_Port, or the name of the switch to which the port is connected will display for an E_Port. If a name (alias) is not available, the WWN displays.
• Type—E_Port or F_Port.
• Cause—The probable root cause of congestion, such as a credit-stalled device connected to the port or an unknown issue. The cause is not displayed for ports in the "mild" congestion category or for E_Ports.
A credit-stalled device is a misbehaving device that stops returning R_RDY signals (buffer credits) promptly to the switch to facilitate transmitting additional frames to that device. This causes the switch to stop sending frames to the device. Credit-stalled devices can be identified by credit latency or frame loss at a port. In the case of frame loss, the credit stall is long enough to cause queue latencies greater than 220 ms to 500 ms.
The following table describes the port conditions that must occur for a specific cause to display in the congestion metrics.
Cause | Port Condition |
|---|---|
Credit Stalled Device | Either Frame Loss, IO Perf impact, or both are greater than 0. |
Unknown | The port condition for Credit Stalled Device has not been met, but congestion is occurring. |
Note: If you receive Monitoring and Alerting Policy Suite (MAPS) alerts indicating excessive CRC errors or CRC errors exceeding set threshold limits, suspect a faulty port transceiver or cable. For more details, refer to the Brocade Monitoring and Alerting Policy Suite Configuration Guide located on http://www.broadcom.com and the Brocade Fabric Congestion Troubleshooting Guide on http://www.mybrocade.com.
• Frame Loss, I/O Perf Impact, Medium, Low, and Info frequency—The number of times the port was in the these congested port states. Refer to Congestion Severity States for more information.
• C3 Tx Timeout (Count) —The number of class 3 (C3) frame transmit timeouts. Transmit (tx) timeouts on an F_Port indicates that the F_Port is the source of congestion and is causing back pressure. Fabric Performance Impact (FPI), a MAPS feature, uses instances of C3 frame timeouts and instances of when transmit buffer-to-buffer credits are at zero to detect credit latency at F_Ports that are connected to credit-stalled devices. Class 3 transmission timeout errors (C3TXTO) on a port will trigger a Frame Loss state for the port.
• C3 Rx Timeout (Count)—The number of C3 frame receive timeouts. Class 3 receive timeout errors (C3RXTO) on a port will trigger a Frame Loss state for the port. Receive timeouts on an F_Port indicates that frames received on the port are being discarded because of back pressure from upstream ports (ISLs or other devices).
• Average latency—Average time that a frame is in the port transmit queue before being transmitted. Increasing latency at an ISL port is an indication of a downstream congestion caused by oversubscription or a credit-stalled device.
• Tx Utilization (%)—The average percentage of link capacity used when transmitting traffic. High bandwidth utilization can indicate a source of oversubscription that can lead to congestion.
• RX Utilization (%)—The average percentage of link capacity used when receiving traffic. High bandwidth utilization can indicate a source of oversubscription that can lead to congestion.
• BB Credit Zero (Count)—The number of times BB Credit was at zero for the port. Incrementing counts of BB Credit Zero indicate credit latency. BB Credit Zero counts are incremented when the transmit credit value is at zero for a specific time period and there is a frame waiting in the queue of the port or the virtual channel for transmission. The frame cannot be transmitted when the credit value is at zero. Credit latency at a device port is an indication of a credit-stalled device. Credit latency at an ISL port is an indication of a downstream congestion caused by oversubscription or a credit-stalled device.
• (V)—Click the down arrow at the end of a port row to display an action menu, and then select Investigate to display the Investigation Mode page for the port. Using this page, you can display more detailed data selected port congestion metrics in configurable time ranges of up to 2 hours with 1-minute granularity.
Figure 13. Investigation Mode Page
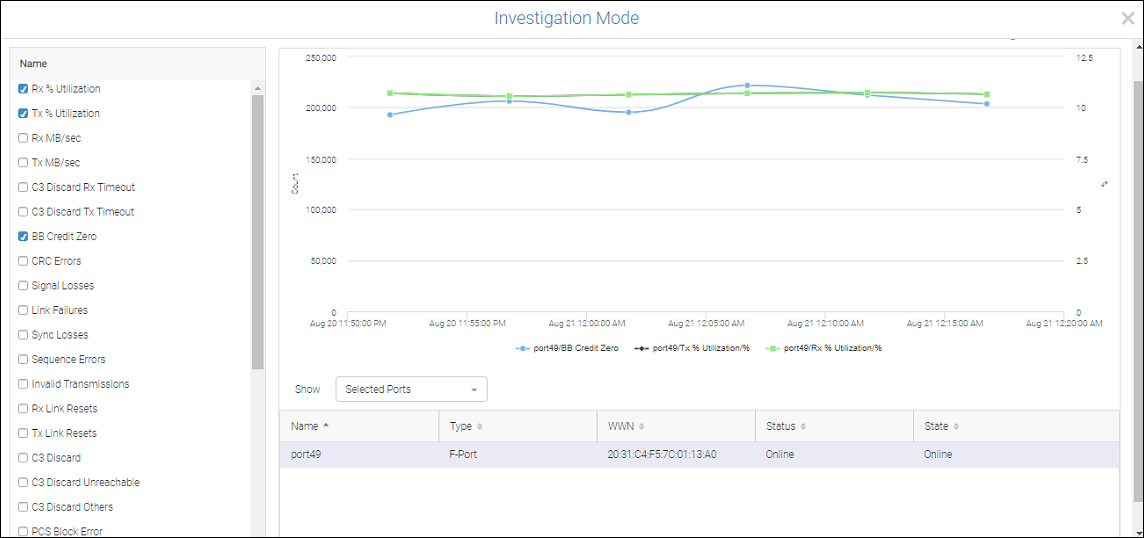
By default, the page will display graphs showing counts of the following congestion metrics over time:
◦ BB credit zero
◦ Tx utilization
◦ Rx utilization
For more information on using the Investigation Mode page, refer to Using Investigation Mode.
For More Information
For more information on metrics used to identify congested ports, troubleshooting congested ports, and identifying the causes and solutions for congestion, see the following:
• For details on the mild, moderate, and severe states used to identify congestion severity in Network Port Traffic Conditions dashboard and Troubleshooting Mode page, see Congestion Severity States.
• For complete information and procedures on troubleshooting port and fabric congestion, refer to the Brocade Fabric Congestion Troubleshooting Guide on http://www.mybrocade.com.
Parent topic