Network Port Traffic Conditions Dashboard
The Network Port Traffic Conditions dashboard provides instant visibility into various network traffic conditions across managed fabrics. The dashboard identifies mildly, moderately, or severely congested F_Ports, E_Ports, and EX_Ports across the entire SAN environment and displays factors that are contributing to the congestion to help you troubleshoot its cause.
For options on displaying the Network Port Traffic Conditions dashboard, go to Viewing Existing Dashboards.
As shown in the following illustration, this dashboard provides a graphical display showing the number of E_Ports, EX_Ports, and F_Ports in severe, moderate, and mild congestion severity states over time. The congestion counts are computed once every minute and displayed for the last 30 minutes, 1 hour, or a maximum of 2 hours.
Figure 11. Graphs Showing the Number of Ports in Mild, Moderate, and Severe Congestion States
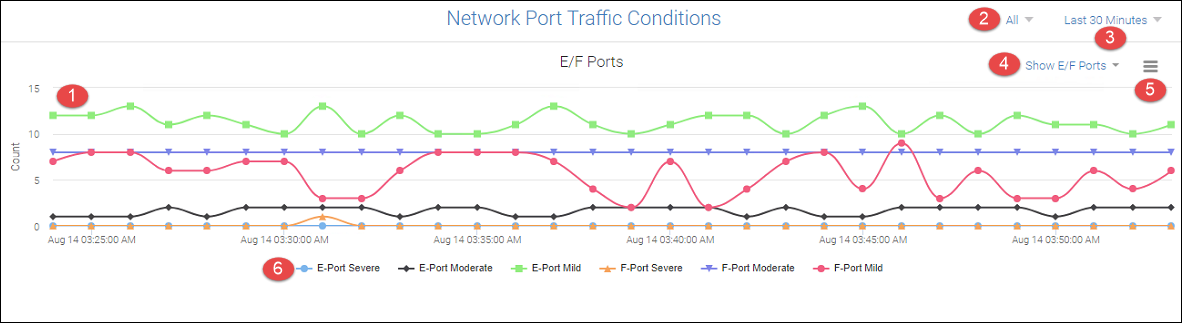
1. Graphs showing port types in various congestion severity states
2. Network scope
3. Date range drop-down
4. Show ports drop-down
5. Hamburger icon for selecting the Troubleshooting Mode page
6. Port type and severity state selectors
The Network Port Traffic Conditions dashboard is supported on Gen 6 platforms operating with Fabric OS 8.2.1 or greater with MAPS enabled.
Congestion is a network traffic condition that occurs when frames are entering a fabric faster than they are exiting the fabric. As a result, frames build up, or congest in switch ports while waiting for transmission. This causes traffic moving through the fabric to slow down or become "congested." Congestion can occur on device F_Ports, E_Ports, and EX_Ports. Back pressure from a congested port in the fabric can cause traffic to slow down on upstream interswitch links (ISLs).
In the graphical display, each port type (F_Ports, E_Ports, and EX_Port) and severity state (mild, moderate, and severe) displays as a different colored line graph. Hover your cursor along a line graph and click data points on the graph to display the number of ports detected in a severity state for that time interval. The current time interval configured for monitoring ports is displayed on the Date Range drop-down at the top right corner of the page.
Add and remove graphs for the following port types and congestion severity states using the port type and severity state selectors below the graph display area:
• E-Port Severe
• E-Port Moderate
• E-Port Mild
• F-Port Severe
• F-Port Moderate
• F-Port Mild
Note: Congestion severity for EX_Ports will display using the E-Port Severe, E-Port Moderate, and E-Port Mild selectors.
For details on these congestion severity states, refer to Congestion Severity States.
To modify the graph display, use the following features:
• Add and remove graphs for different port types and severity levels by clicking a port type and severity state selector below the graph display. Each selector is color-keyed to a line graph.
◦ Click a fully-visible selector to deselect it and remove the graph.
◦ Click a partially-visible selector to select it and add the graph.
• Add and remove graphs for the port types only (F_Ports, E_Ports, or E_Ports and F_Ports), by clicking the Show Ports drop-down at the top right corner of the Network Port Traffic Conditions graph display area.
• Select fabrics for congestion monitoring by clicking the Network Scope icon in the top-right corner of the page. Select All discovered fabrics or specific discovered fabrics. For more information on using this selector, refer to Setting Network Scope and Date Range.
• Select a time or date interval for monitoring ports for congestion severity states by clicking the Date Range drop-down at the top right corner of the page. Depending on where you are viewing the Network Port Traffic Conditions dashboard, selectable time intervals vary as follows:
◦ If viewing the dashboard in the Content Management tab, selecting the drop-down displays the Select Date Range dialog box where you can select the last 30 minutes or hour, day, and more extended time periods. For more information on using this dialog box, see Setting Network Scope and Date Range.
◦ If viewing the dashboard in the Dashboard View, selecting the drop-down allows you to select the last 30 minutes, 1-hour, or 2-hour time periods for data display.
For more information on metrics used to identify congested ports, troubleshooting congested ports, and identifying the causes and solutions for congestion, see the following:
• For detailed monitoring and display of port metrics used to determine the congestion severity states in the congested ports line graphs, display the Troubleshooting Mode page. To display this page, click the hamburger icon at the top right corner of the Network Port Traffic Conditions graphical display and select Troubleshoot. Refer to Troubleshooting Mode for details on this page.
• For details on the mild, moderate, and severe states used to identify port congestion severity in this dashboard, see Congestion Severity States.
• For complete information and procedures on troubleshooting port and fabric congestion, refer to the Brocade Fabric Congestion Troubleshooting Guide on http://www.mybrocade.com.
Parent topic