Creating Report Content
You can create summary reports from data gathered from all SANnav Management Portal instances.
Similar to SANnav Management Portal, SANnav Global View provides support for report generation, where Portal Scope is based on one or more Management Portal instances. Unlike SANnav Management Portal, however, SANnav Global View provides no filters, and reports are limited to Inventory.
All other capabilities related to report content (such as scheduling) and report generation/export in HTML, PDF, and CSV formats are the same as in SANnav Management Portal. The following Inventory reports are supported in SANnav Global View and display in tabular form:
• Fabrics
• Switches
• Switch Ports
Content Management is the key to creating and generating reports. First you determine which widgets you want contained in the report, and then you save your listing. At the outset there is no data in the report. To populate a report, you must generate it.
When you create report content, a default set of columns is included. You can customize this list as well as change the default names for each report section.
You can create several types of report content like one for daily reports and one for weekly reports. Or, you can create separate content for individual data centers and one content for all the data centers together.
Perform the following procedure to select and save widgets for your report.
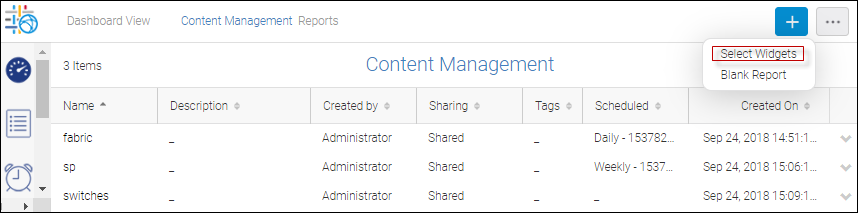
1. Click the Dashboard icon (  ), and then click Content Management in the top navigation bar.
), and then click Content Management in the top navigation bar.2. Click the + icon in the upper right corner, and then select Select Widgets.
3. On the Select Widgets dialog, select whichever widgets you want from the list on the left, and click the arrow to move these widget to the right side.
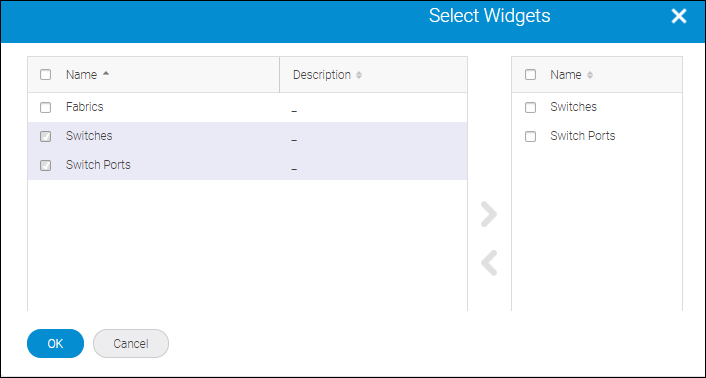
4. Click OK.
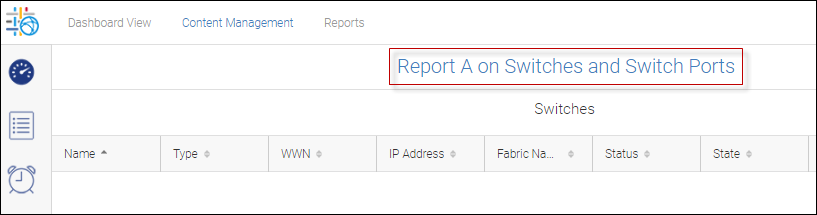
A report layout is created with a default name and default columns, which you can now customize.
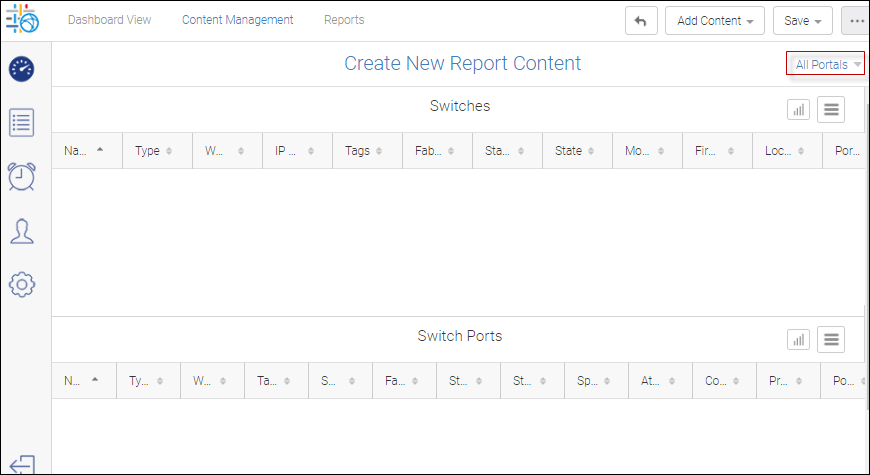
5. Click the All Portals drop down, and then select the instances of SANnav Management Portal the report should include.
Deselect whichever Portals you do not want to include.
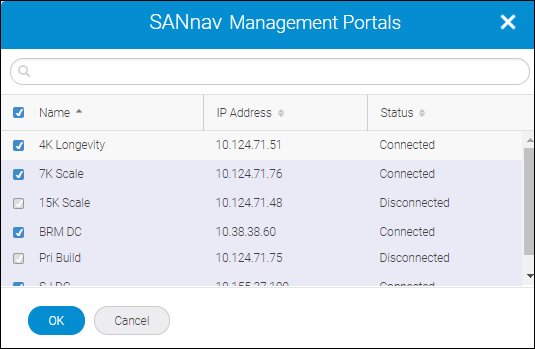
6. Click OK.
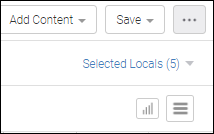
The All Portals drop-down changes to Selected Locals and indicates the number of portals selected.
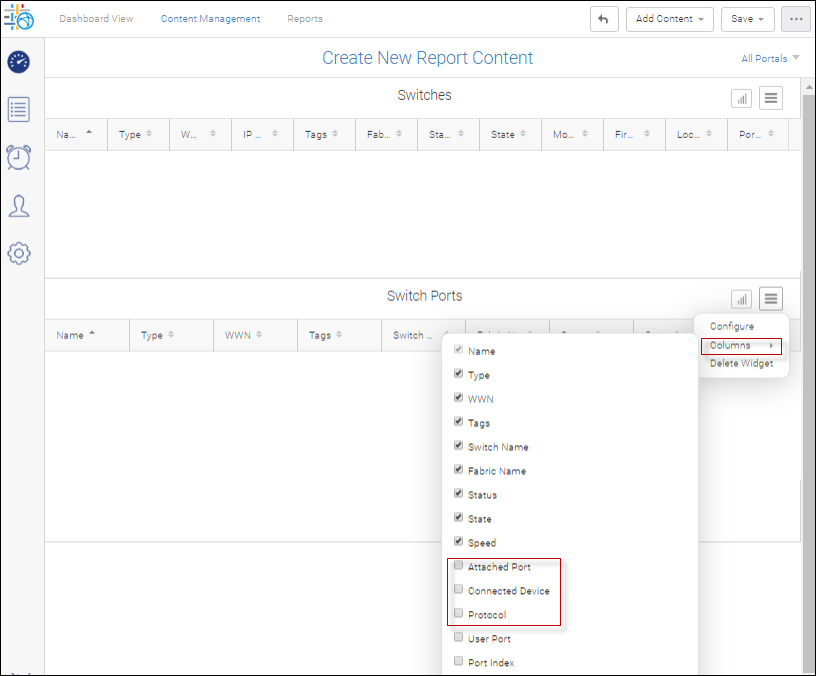
7. Select the columns you want to include in the report.
a. For each section in the report, click the hamburger menu on the right side of the window, and select Columns.
A list of all potential columns displays.
b. Scroll down the list and select the columns you want to include. Click anywhere outside the list window to close it.
8. To rename each section of the report, click the hamburger button (  ), select Configure, add a new section name, and click OK.
), select Configure, add a new section name, and click OK.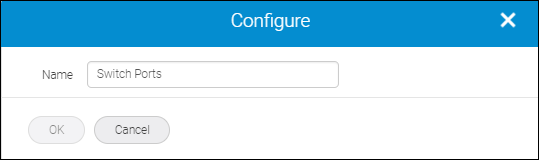
9. Click Save to save your report.

10. Enter a name for the content and check Shared if you want other SANnav Global View users to view the content.
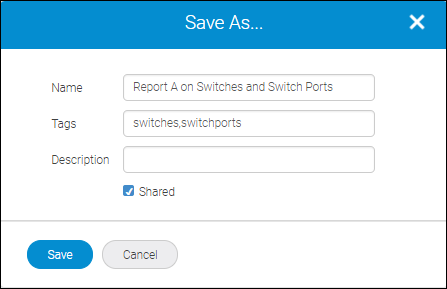
11. Click Save.
The Create New Report Content page appears with the saved name.
12. Click Content Management on the top navigation bar to verify that your content has been added.
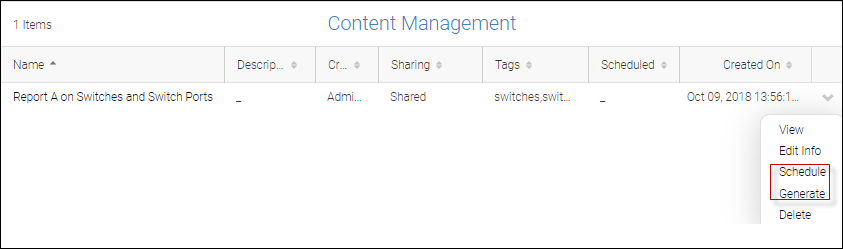
13. To set a time to run a report, click Schedule on the action menu.
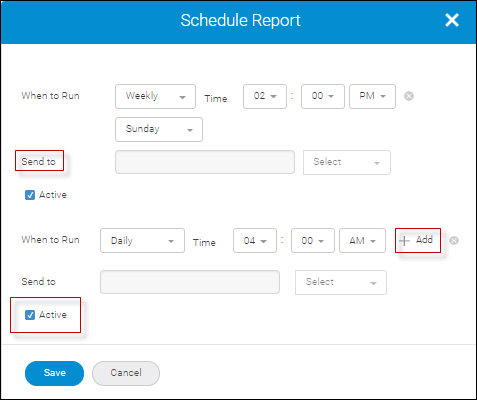
Note: SendTo enables you to forward a report to one or more email addresses. However, this functionality requires that you establish a mail server in Settings.
By default, the dialog displays only one schedule option. Clicking +Add shows additional schedule templates.
Checking Active enables the schedule.
In the following screen shot you have enabled two schedules: a weekly schedule that runs at 2 p.m. on Sunday and a daily schedule that runs at 4 a.m.
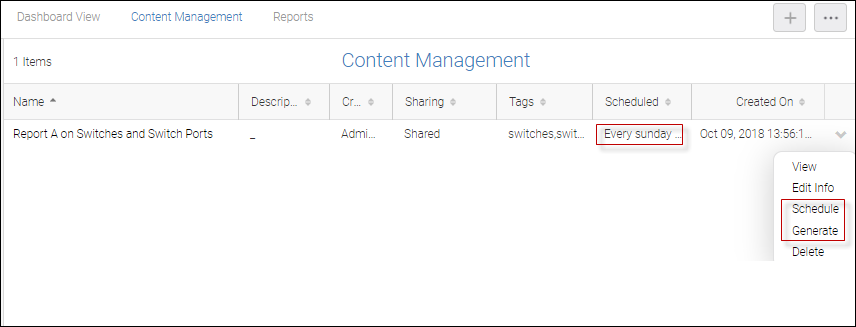
14. To run an on-demand report, click Generate on the action menu on the Content Management page for the desired report .
The new report displays under the Reports tab of the navigation bar.
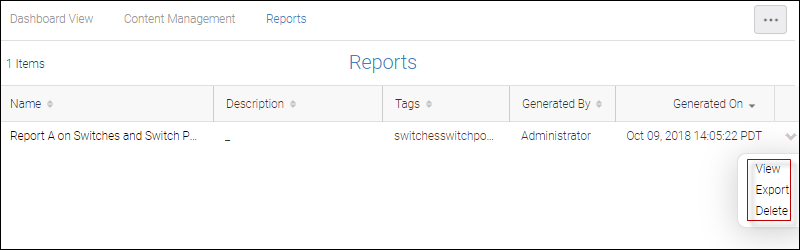
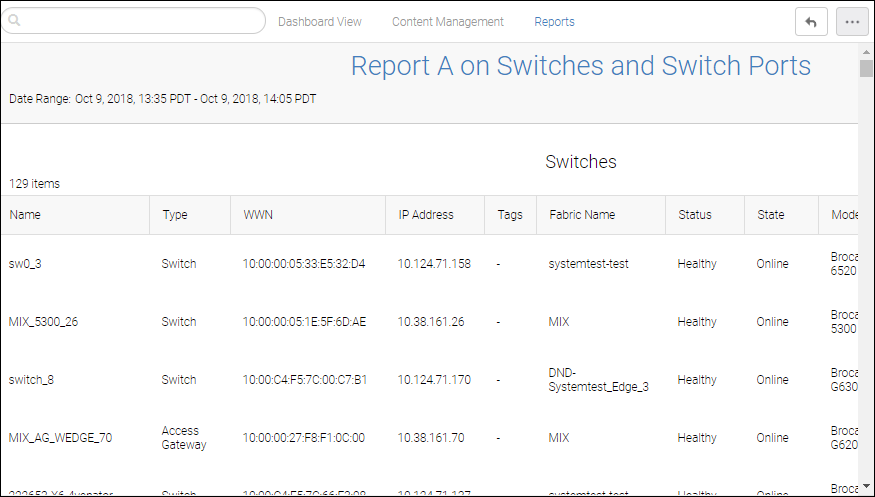
15. Click View on the action menu.
16. You can also export the report as a zip file to one or more users, by clicking Export on the action menu under the Reports tab.
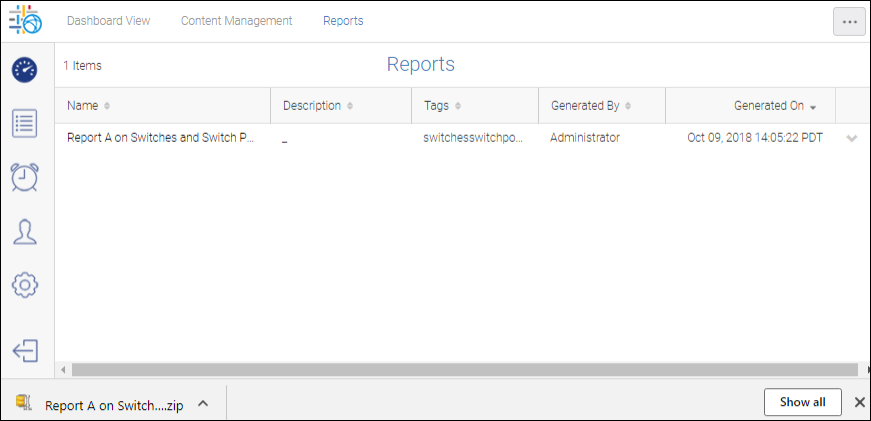
The zip file contains an HTML and PDF version of the report, and a comma-separated value (CSV) file for each section in the report.
Parent topic