Quick Tour of SANnav Global View
You can easily navigate to different views of the application by clicking the icons in the left navigation bar.
When you log in to SANnav Global View, you see the Summary dashboard, the single dashboard provided with Global View.
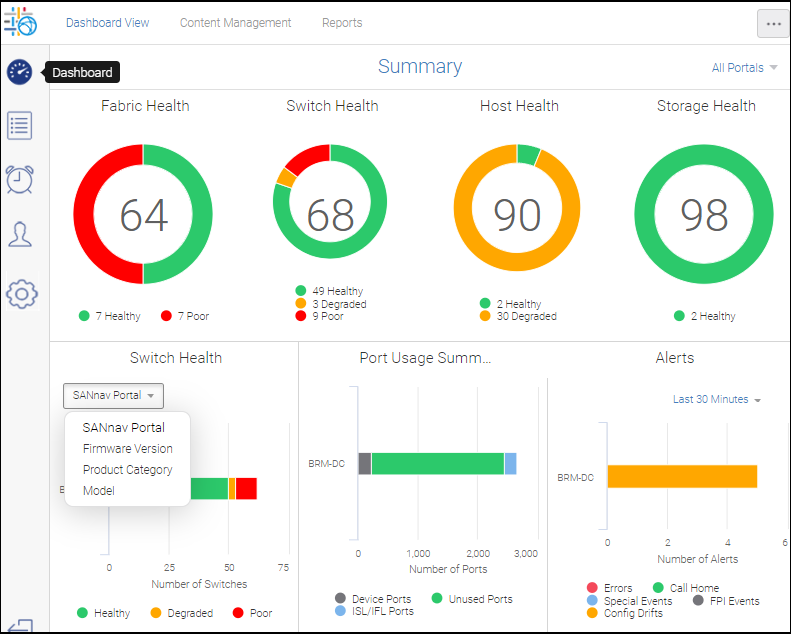
On the left side of the dashboard is a navigation panel where you can select from among the Dashboard, Inventory, Events, Preferences, and Settings tabs. Selecting the Dashboard tab displays the singular Global View Summary dashboard.
On the Global View Summary dashboard, Dashboard View, Content Management, and Reports are listed on the top navigation bar. (By default, Dashboard View is enabled.) Content Management lists all available report content and provides actions for creating and updating the content. The Reports tab allows you to view the generated reports.
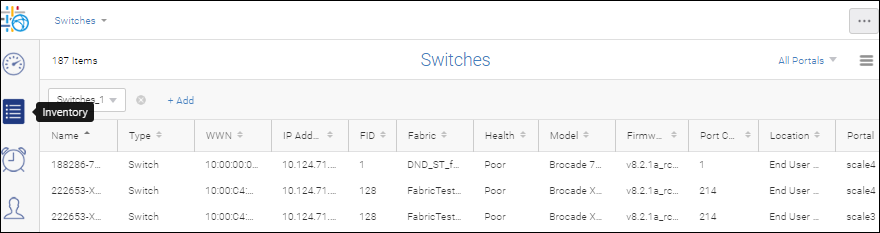
The Inventory tab provides Global View inventory information about fabrics, switches, switch ports, host and storage devices, and host and storage ports.
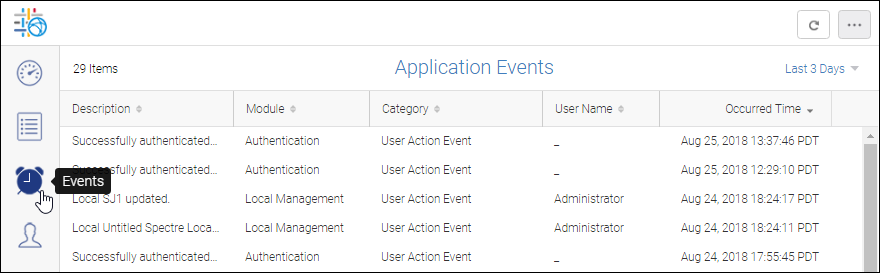
The Events tab lists all Application events, stemming from either a user or system action. A system action is triggered under certain situations like when a portal is disconnected. The Events list has no filter or search capability.
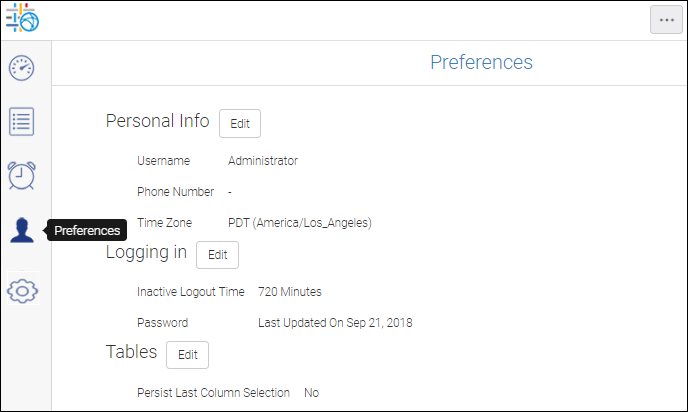
The Preferences tab is where you can add your phone number and change your password. It is also where you can enable "Persist Last Column Selection." wherein the system remembers your column customization. Column customization is the ability to choose what columns you want to see in a tabular view. For example, by default, few of the many available columns in Inventory are shown, but you can customize the table by adding or removing columns.
The Configurations and Settings tab enables you to perform various configuration settings across several feature categories. Details on these categories are found elsewhere in this guide.
Parent topic