Viewing Connectivity between Hosts and Storage
Using the SANnav Management Portal Topology feature, you can view your hosts and storage, and all paths between them.
This example shows how to access the topology through the dashboard, starting from a host. You can also start from a storage device.
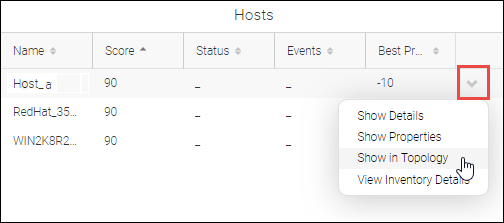
1. Go to the Health Summary Dashboard, click the down arrow next to a host (or storage device) to open the action menu, and click Show in Topology.
Although you can start from the Inventory page or the Topology page, this step shows how to start from the Health Summary Dashboard and select the item you want to view.
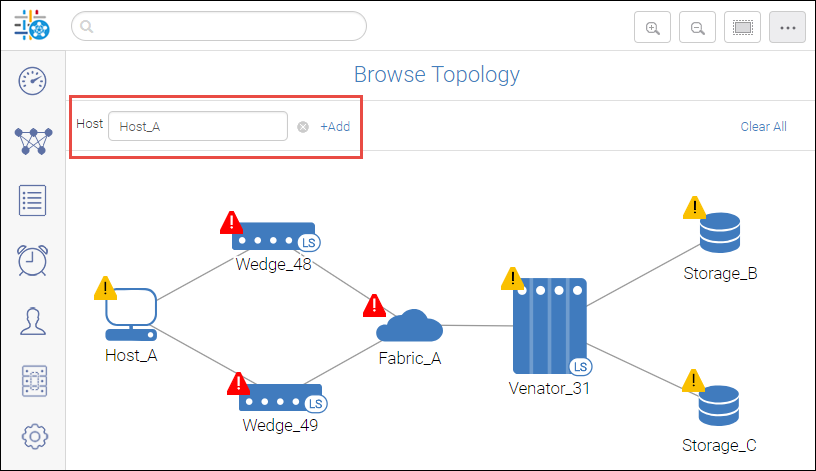
The Browse Topology page displays a pictorial view of the fabric from the host context. Note the host shown in the context navigation panel. You can see the host, along with all paths to the storage devices that the host connects to. In this example, the host has two paths to each of the storage devices.
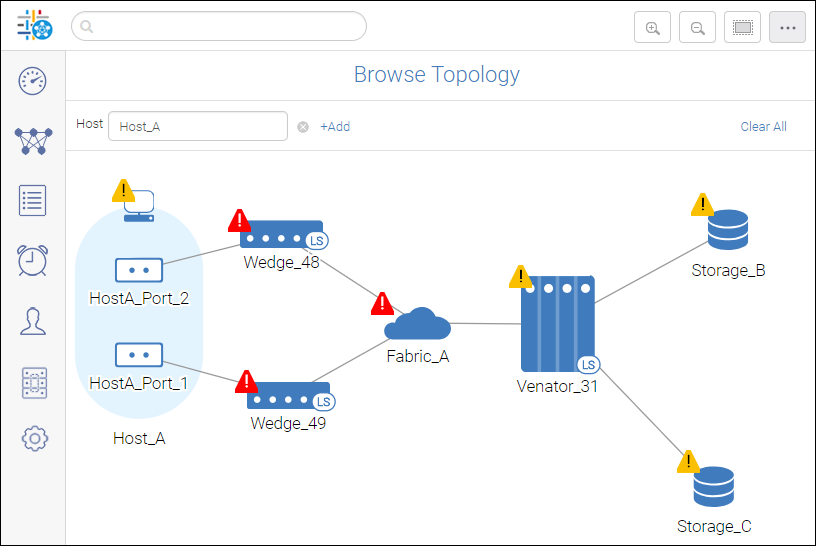
2. For additional information about the ports, hover over the host icon, and click the + icon.
You can drill-down even further and display the virtual ports associated with the host or storage ports. Hover over a host or storage port icon, click the hamburger icon (  ), and select Show Virtual Ports to display the associated virtual ports in tabular format.
), and select Show Virtual Ports to display the associated virtual ports in tabular format.Notice that some of the icons have yellow or red warning symbols, indicating degraded or poor health, respectively. You can get additional details about the warnings.
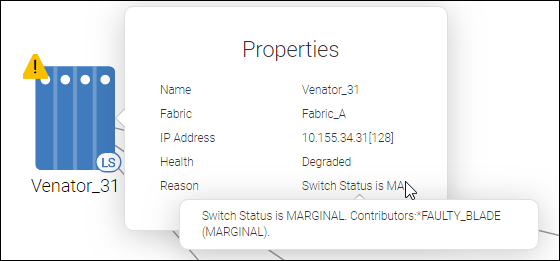
3. Hover over a switch icon, click the hamburger button, and select Show Properties.
In the following example, the switch health is Degraded. Although the reason is truncated, you can hover over the text to display the full reason for the degraded switch status.
Parent topic