Health Summary Dashboard
The Health Summary dashboard provides an overall view of network health from various perspectives: fabrics, switches, hosts, and storage. You start with an overview picture of network health, and then drill down to investigate specific problems.
The Health Summary dashboard is the default dashboard when you install SANnav. Note that you can change your default dashboard. Each user can select a different default dashboard.
Figure 10. Health Summary Dashboard
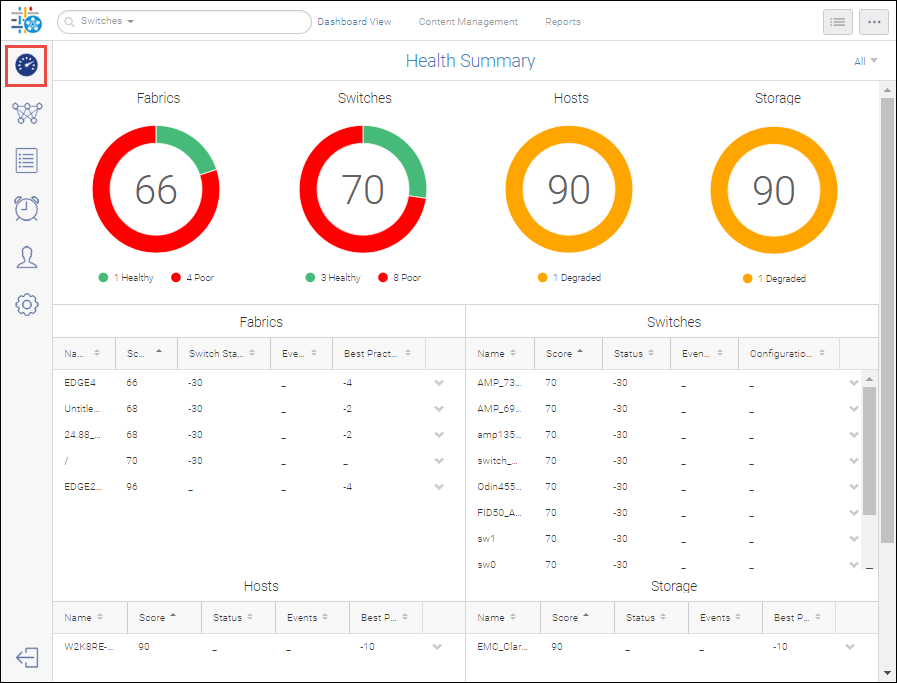
The Health Summary dashboard consists of eight widgets: Fabrics, Switches, Hosts, and Storage.
• Four graphical widgets
• Four tabular widgets
For the graphical widgets, the number in the center of each circle is the health score of the least healthy member in that category. For example, if you have 100 switches, of which 99 have a health score of 100 and 1 has a health score of 40, then 40 is displayed in the center of the switch circle. In the above screenshot, the least healthy switch has a score of 70 and the least healthy fabric has a score of 66. The health score is computed based on various factors, such as status, events, and best practice violations.
The overall health is determined by the health score:
• If health score is greater than 90, then health is Healthy.
• If health score is between 71–90, then heath is Degraded.
• If health score is 70 or less, then health is Poor.
The tabular widgets display details about the health score of each member. Click the down arrow at the right of each table entry to display additional actions you can take, such as viewing inventory details, displaying properties, or (for switches) opening in Web Tools.
By default, all objects in your area of responsibility (AOR) are displayed. If you want to focus on a particular fabric, you can change the network scope by selecting a fabric from the drop-down list in the upper right corner of the dashboard.
The Health Summary dashboard is automatically updated every 15 minutes when viewed as a live dashboard (from the Dashboard View).
The Health Summary dashboard is one of the predefined dashboards in SANnav, so you cannot modify it to add or delete widgets. You can, however, use these widgets in custom dashboards.
Parent topic