Viewing the Fabric Topology
After you discover a fabric, you might want to view a pictorial representation of the fabric, including the switches, ports, and connected devices.
You can launch a topology view in several ways, including from the action menu on the Inventory page and Health Summary Dashboard. The following procedure shows how to launch the topology view from the Topology page, by adding a context.
1. Click the Topology icon (  ), and then click the + button to add a context.
), and then click the + button to add a context.
2. In the Add Context Type dialog box, select the Fabric context, and click OK.
3. In the Fabric context field, type the name of the fabric, and press Enter.
SANnav provides suggestions as you type.

The Browse Topology page displays a pictorial view of the fabric. This is the fabric context, so the topology displays all switches in the fabric. Note the fabric shown in the context navigation panel.
This fabric has four switches. Two of the switches are directors.

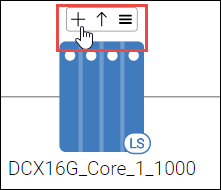
4. Hover the mouse over each switch and click the + icon to display the physical ports.
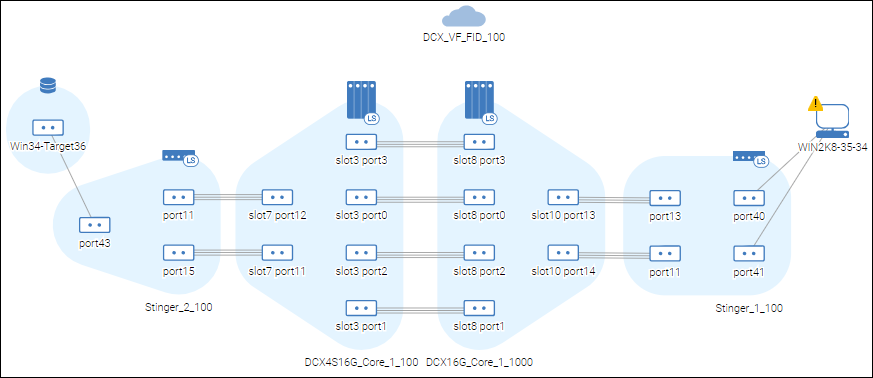
The topology now shows the physical ports and the connections between them. (Virtual ports are not shown.) Notice that the switches are connected with trunk links.

Note: If the number of connected ports is greater than 15, SANnav displays the ports in a tabular view.
5. Hover over a port icon, click the hamburger icon (  ), and select any of the attributes.
), and select any of the attributes.For example, if you select Show Trunk Links, a popup window displays the master trunk links.

6. Hover the mouse over the fabric icon or a switch icon, click the hamburger icon, and select any of the attributes. .
For example, select Show End Devices.

The topology now shows the end devices connected to the switches.
7. Hover over one of the switches, and click the up arrow to change to the switch context.

Clicking the up arrow adds a context to the context navigation panel, which is "up" or at the top of the topology window.
Now the topology is in the switch context and displays all switches and devices directly connected to the selected switch. Notice that the context navigation panel now contains two contexts.
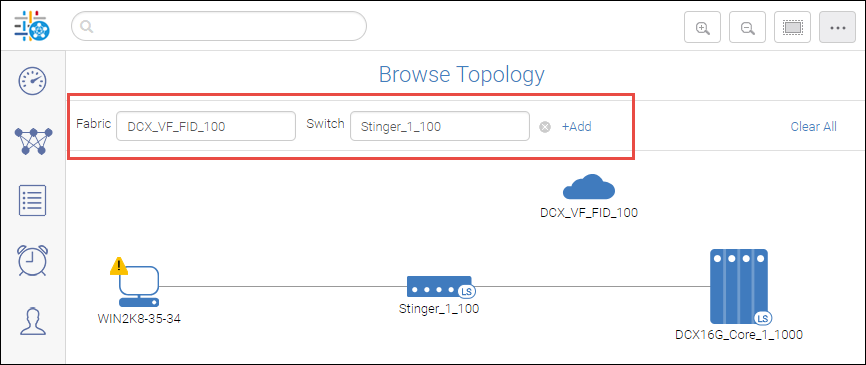
You can keep adding contexts by hovering over an object and clicking the up arrow, or by clicking +Add in the context navigation panel to add context type relevant to the current contexts. Hover over the More button to see the older contexts. Up to eight contexts are retained. If you add more than eight contexts, the older contexts are deleted.

Note: If the browser is refreshed, only the latest chosen context is displayed, and the other contexts are deleted.
To go back to the previous context, click the X in the context navigation panel, or hover over the selected object and click the down arrow.
8. If necessary, adjust the appearance of the topology.
◦ Click any of the device icons (fabric, switch, port) and drag it to a new location.
◦ Click the background and drag the entire topology to reposition it in the window.
◦ Use the scroll button on the mouse or the zoom buttons in the upper right corner of the window to resize the topology view.
◦ Click the Reset View button in the top left corner to re-center and resize the topology to fit in the view.

Parent topic