Creating Custom Content for a Dashboard View
In this section, you will see how to create custom content. You can then save the content and access it at any time to monitor and troubleshoot various network objects such as fabrics, switches, and ports.
You can create custom content in one of two ways:
• Select from the available widgets using the system default layout and view.
With this option, you can select several widgets at once, and add them to the dashboard. The layout is three widgets in each row. Select this option if you do not care about the row arrangement of the widgets, or if you want to add a lot of widgets at one time.
• Start with a blank template and select widgets to customize the layout and view for each widget container and row.
With this option, you can create the empty dashboard first then add the widgets in the exact order/layout you want. This way is preferred if you want to arrange widgets in a specific order. It might be less so if you have many widgets in the dashboard, because you would need to add them one at a time.
Custom dashboards can be shared with other users. By default, system-defined dashboards are shared and available for all users. If a dashboard is shared, it can be used by other SANnav users to monitor and troubleshoot their networks.
Creating Content with Available Widgets
You can create a dashboard with the available widgets.
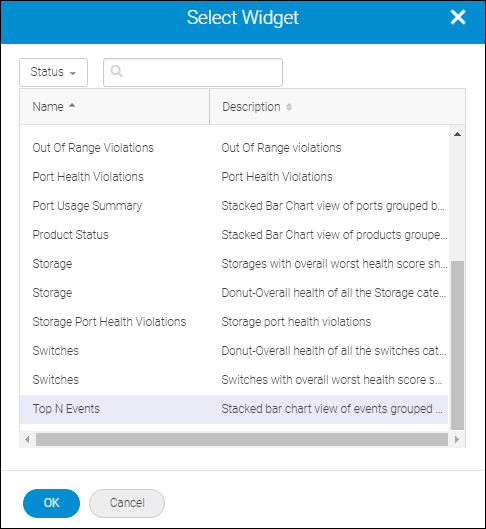
1. On the Content Management page, click + and then select Dashboard > Select Widgets.
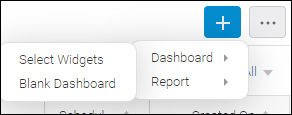
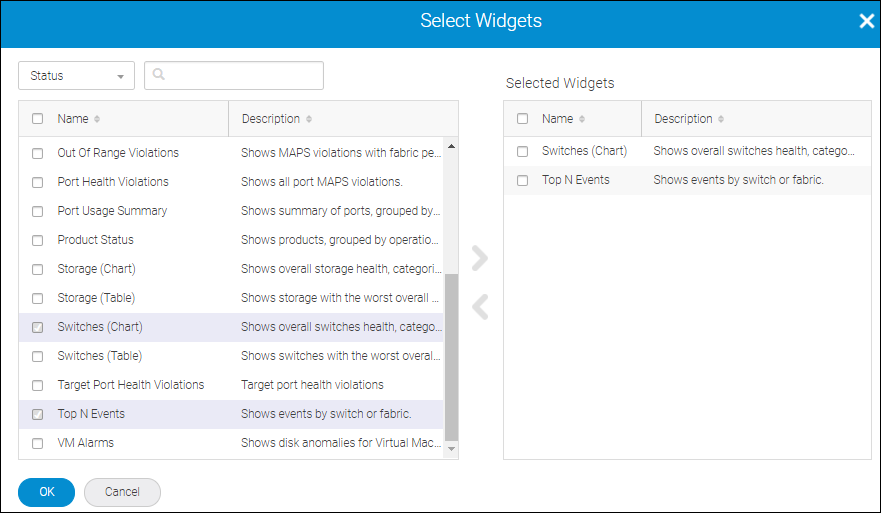
The Select Widgets dialog displays with widgets of type Status.
2. Check the widgets you want in your custom content and click the right arrow to move them to the Selected Widgets list.
The order of the widgets in the Selected Widgets list is the order that they are displayed in the dashboard.
If you select numerous widgets at once and then click the right arrow to move them to the Selected Widgets list, the widget sequence is maintained. There is no re-sorting after the move.
If you want the widgets in a particular order, select each widget separately and then click the right arrow before selecting the next widget.
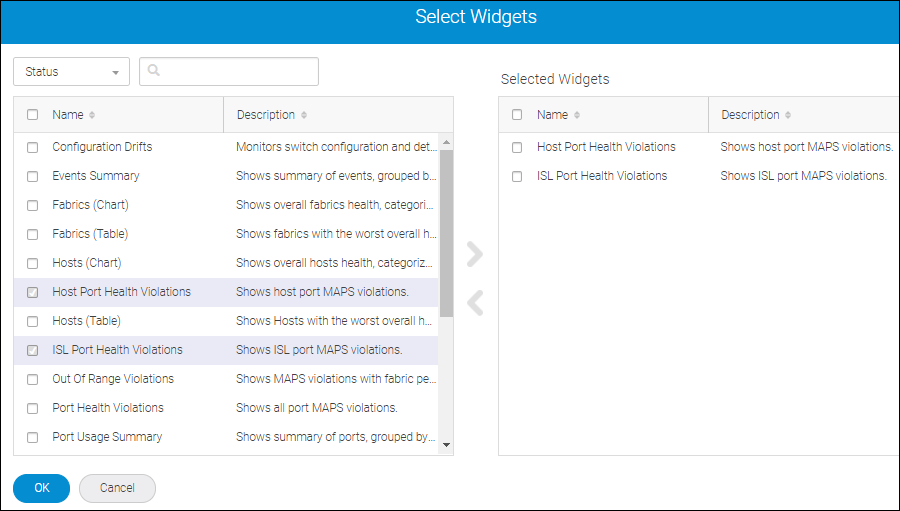
3. Click OK.
The Create New Dashboard Content page displays with the selected widgets.
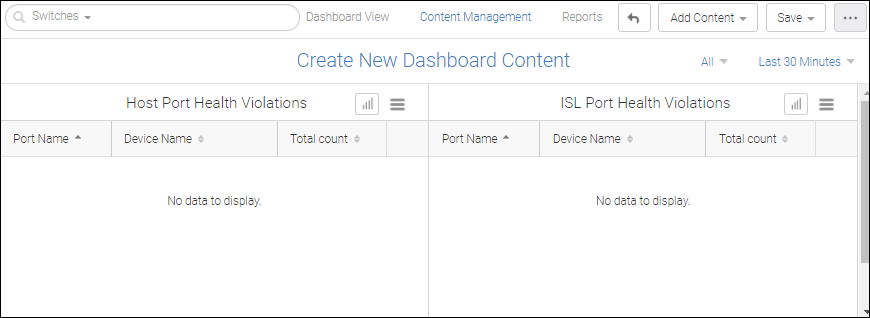
4. Click Save to preserve this dashboard.
Adding Content to a Dashboard
To a customized dashboard, you can add additional content.
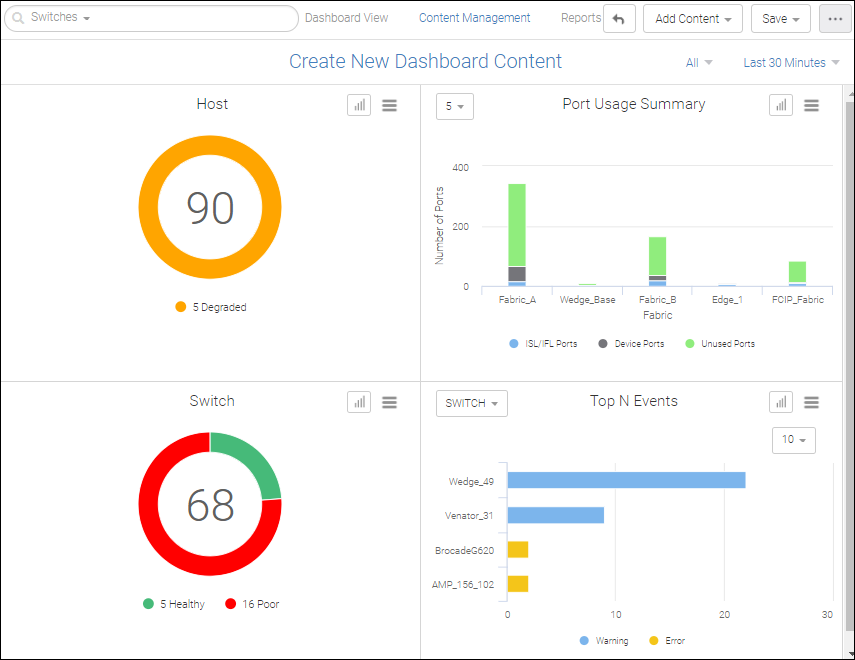
In the following screen capture, a customized dashboard consists of the measures Host and Port Usage Summary.
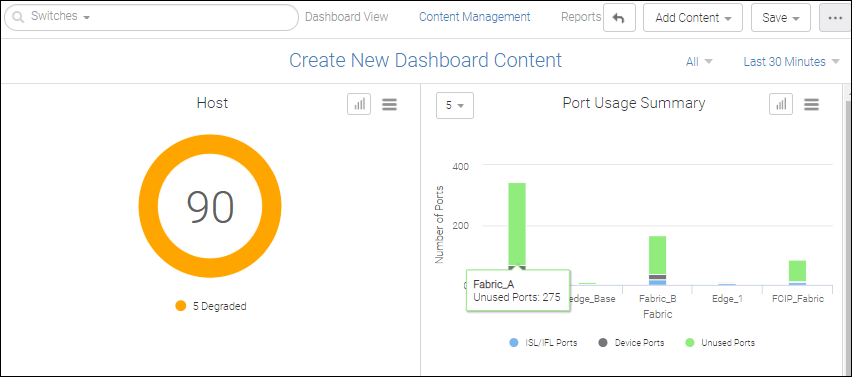
To add more content, perform the following:
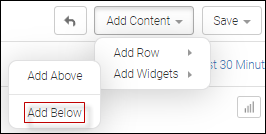
1. Click Add Content > Add Widgets > Add Below from the menu at the top right of the Create New Dashboard page.
2. Select two widgets on the Select Widgets dialog and move them under Selected Widgets.
The dashboard content is updated with two additional widgets.
3. Select Save > Save as to provide the dashboard a name and save it.
During creation, you can use Save and Save As to save your new content. However, if you are updating content and you want to save the content with a new name, use Save As.
Note: Each dashboard must have a unique name.
Creating Content from a Blank Dashboard
You can create a dashboard from a blank template.
1. On the Content Management page, click +, and then select Dashboard > Blank Dashboard.
The Create New Dashboard dialog displays.
2. From the top right of the Content Management page, select Add Content > Add Rows and select one of the pre-defined row formats.
Create New Dashboard dialog displays in layout view with placeholders for the widgets.
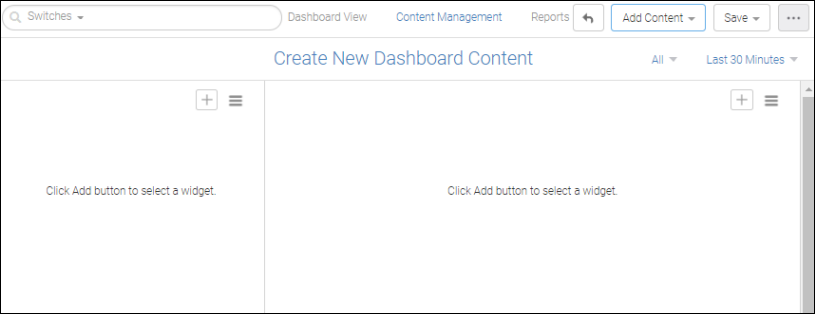
With the Add Row and Add Widget dialogs, you can place widgets in this dashboard view according to your preferences.
Note: Although you can create an unlimited number of custom content setups, the maximum number of performance widgets you can use in one custom content setup is 30.
3. Rerun Step 2 to add another row.
4. Click the + icon on the top-right of the placeholder to populate the first widget placeholder with an actual widget. This displays the Select Widget window.
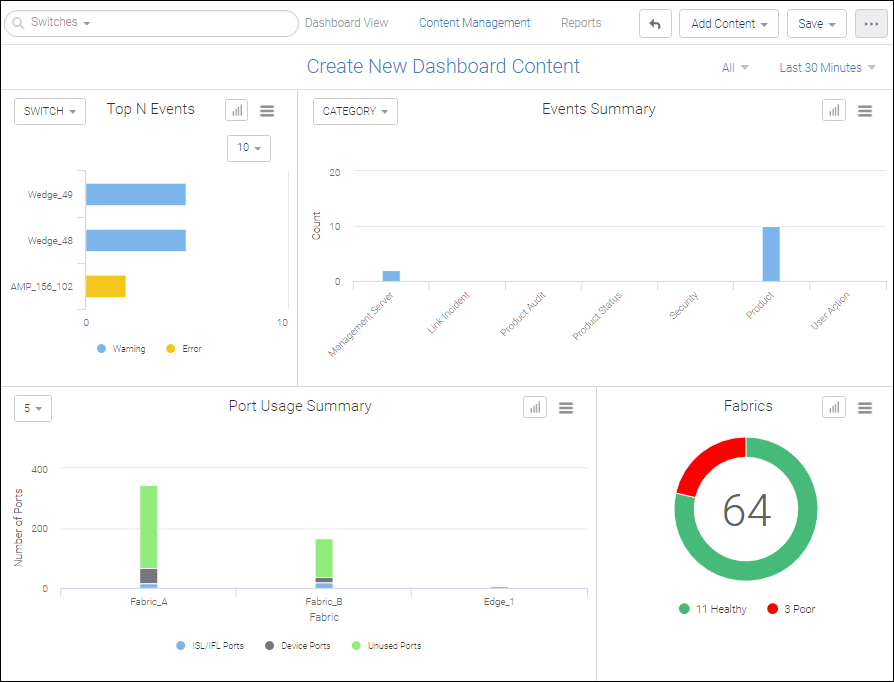
5. Select Top N Events.
6. Select widgets for each of the other placeholders: Events Summary, Port Usage Summary, and Fabrics, respectively. The dashboard will appear as follows.
7. Select Save > Save as to give the dashboard a name and save it.
Parent topic